
The Complete Guide to False Confidence in Delivery

Learn why software delivery appears on track while hidden constraints, weak signals, and flawed forecasts undermine delivery predictability.
Executive Summary
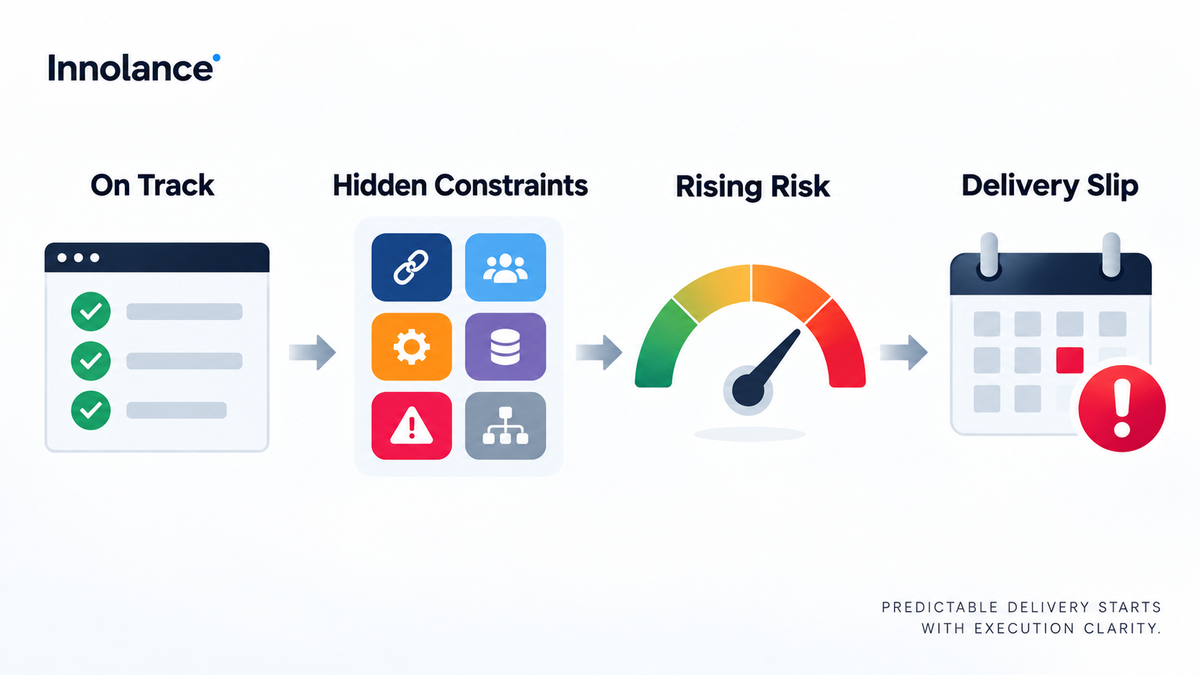
Software delivery can appear healthy even when the conditions supporting future commitments are deteriorating. Roadmaps remain green, sprint completion looks stable, and teams stay busy, yet unresolved dependencies, decision delays, quality issues, and unrealistic assumptions may already be increasing delivery risk.
For engineering leaders, improving software delivery predictability requires more than tracking whether work is currently on schedule. Leaders need to understand whether the signals behind that status are reliable.
Direct Answer: False confidence in delivery occurs when surface-level metrics suggest that work is on track while hidden constraints, weak execution signals, and flawed forecasting assumptions increase the likelihood of delays. Leaders can reduce this risk by combining delivery data with dependency, workflow, capacity, and decision-flow analysis.
Why Can Delivery Look On Track When It Is Not?
Traditional reporting often emphasizes completed work, milestone status, sprint progress, and roadmap health.
These indicators are useful, but they can create a misleading sense of certainty when viewed without the conditions influencing future delivery.
A release can remain green while a dependency is unresolved. Teams can complete sprint work while testing queues grow. A roadmap can look stable even though priorities are changing faster than teams can absorb them.
This creates a gap between reported progress and actual delivery confidence.
Key Takeaway: Green status shows what has happened so far. It does not always show whether the current plan is still achievable.
What Creates False Confidence in Software Delivery?
False confidence usually develops when several weak signals are ignored at the same time.
Common causes include:
- Unresolved cross-team dependencies
- Increasing work in progress
- Frequent priority or scope changes
- Delayed technical or business decisions
- Repeated carryover between iterations
- Growing defects or rework
- Capacity that no longer matches commitments
- Forecasts based on outdated assumptions
Together, these conditions can create software development bottlenecks that make future delivery increasingly uncertain.
Why Do Forecasting Assumptions Become Unreliable?
Delivery forecasts depend on assumptions about scope, capacity, dependencies, sequencing, and timing.
The problem begins when those assumptions change but the forecast does not.
A dependency may take longer than expected, available capacity may decrease, or additional rework may consume time originally allocated to planned delivery.
Accurate release planning therefore requires leaders to continually compare the original plan with current execution conditions. Forecasts should evolve when the evidence changes.
How Can Leaders Diagnose False Confidence?
Effective software delivery diagnosis compares visible status with underlying execution signals.
Leaders should ask:
- Are commitments still stable?
- Which dependencies remain unresolved?
- Is work accumulating in review or testing?
- Are decisions taking longer?
- Is rework consuming more capacity?
- Are teams repeatedly carrying work forward?
- Has the forecast changed as execution conditions changed?
When these signals deteriorate while status remains green, leaders may be looking at false confidence rather than predictable delivery.
Which Signals Matter Most for Delivery Risk Management?
No single metric explains delivery health.
Useful indicators include Commitment Reliability, Cycle Time, Lead Time, Work in Progress, Decision Velocity, dependency health, quality trends, and Roadmap Health.
The value comes from interpreting these metrics together. For example, rising cycle time alongside increasing work in progress may indicate a workflow constraint. Declining commitment reliability combined with frequent priority changes may reveal planning instability.
This helps delivery risk management move from retrospective reporting toward earlier intervention.
How Does Execution Clarity Expose Hidden Delivery Risk?
Execution Clarity the ability to understand where execution is breaking down and why helps leaders identify hidden constraints before they become visible delivery failures.
It connects signals across leadership priorities, portfolio planning, and team execution, helping leaders understand whether risk originates from capacity, dependencies, decisions, workflow conditions, or planning assumptions.
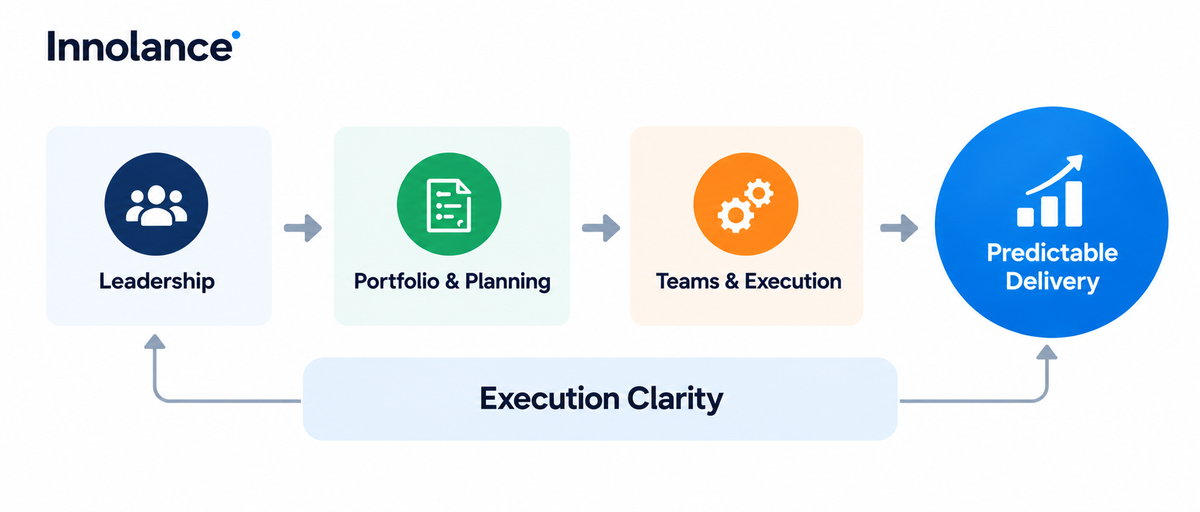
Innolance approaches delivery predictability from this organizational perspective, helping leaders move beyond surface-level status and identify the execution conditions that are actually shaping delivery outcomes.
How Should Leaders Improve Delivery Confidence?
Start by separating confidence from status.
A project can be green today while confidence in the next milestone is falling. Leaders should evaluate not only where work currently stands but whether the conditions supporting future commitments remain healthy.
A simple review is:
Status → Signals → Assumptions → Risk → Forecast
If one of these changes, the delivery forecast should be reassessed.
What Should Leaders Do Next?
Begin with one important roadmap commitment and examine the evidence behind it.
Review dependencies, capacity, workflow queues, quality trends, and decision delays. Compare these conditions with the assumptions used when the commitment was made.
If those assumptions no longer hold, adjust the forecast early rather than waiting for the milestone to turn red.
Predictable delivery starts with Execution Clarity.
Conclusion
False confidence in delivery develops when visible progress looks healthy while the conditions supporting future execution become unstable.
By combining surface metrics with deeper workflow, dependency, quality, and forecasting signals, engineering leaders can strengthen delivery performance, improve software delivery predictability, and act on risk before delays become visible.